Property Investment Market Analysis
📋 Lab Reference
Associated Lab File: pipeline-1.lab.js
🚀 Goal: Smart Property Investment Analytics
Your platform has caught the attention of real estate investors who need data-driven insights to make informed investment decisions. They want to understand market segments, pricing patterns, and property performance across different bed counts. As the backend engineer, you’re tasked with creating a market analysis that reveals investment opportunities.
In this foundational aggregation exercise, you’ll learn essential MongoDB pipeline concepts by analyzing property market segments. You’ll work with real-world data challenges like filtering invalid data, calculating meaningful business metrics, and formatting results for investment decision-making.
🎯 Exercise Desiderata: What You Need to Build
Your mission is to create an aggregation pipeline that provides clean investment market analysis by:
🔍 Data Quality Control:
- Filter for legitimate investment properties:
price > 0andnumber_of_reviews > 0 - Focus on residential properties with
bedsbetween 0-10 andaccommodates > 0 - Exclude test data and extreme outliers that would distort market analysis
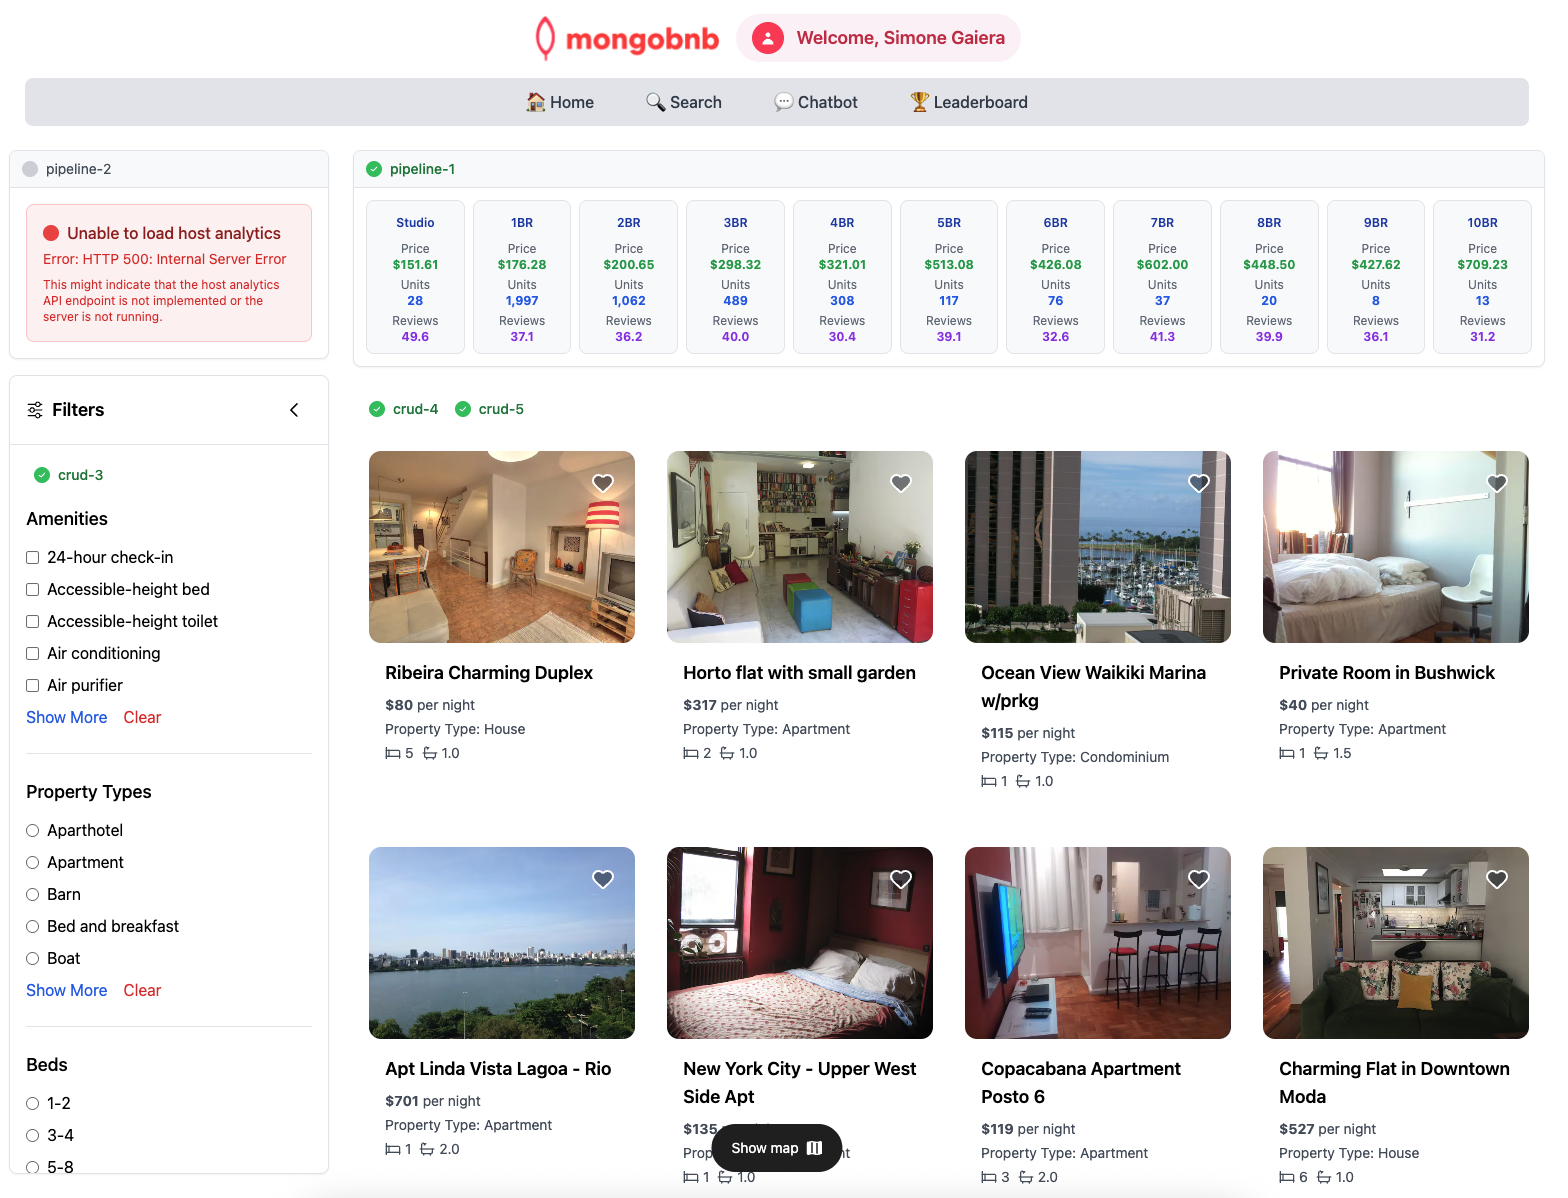
📊 Market Segmentation:
- Group properties by bed count to create meaningful market segments
- Calculate key investment metrics: average pricing, market size, and guest activity
- Generate insights for each segment from studios (0 beds) to large homes (10 beds)
🎨 Business-Ready Output:
- Transform technical data into investor-friendly format
- Round numerical values appropriately for financial presentation
- Remove technical MongoDB fields for clean business reports
🧩 Exercise: Step-by-Step Implementation
-
Open the File
Navigate toserver/src/lab/and openpipeline-1.lab.js. -
Find the Function
Locate theaggregationPipelinefunction with detailed instructions. -
Build the 4-Stage Pipeline
- Stage 1 - $match: Filter for quality investment properties (
price > 0,number_of_reviews > 0,bedsbetween 0-10,accommodates > 0) - Stage 2 - $group: Group by
bedsfield and calculateaveragePrice,propertyCount, andaverageReviews - Stage 3 - $project: Transform output with
_id: 0,beds,averagePrice(rounded to 2 decimals),propertyCount,averageReviews(rounded to 1 decimal) - Stage 4 - $sort: Sort by
bedsfield ascending (1) for logical progression from studios to large homes
- Stage 1 - $match: Filter for quality investment properties (
🚦 Test Your API
- Go to
server/src/lab/rest-lab. - Open
pipeline-1-statistics-lab.http. - Click Send Request to hit the API.
- Verify you get market segments with pricing and property counts for beds 0-10!
🖥️ Frontend Validation
- Check the “Show Statistics” section to see your market analysis in action.
- Each segment should display as a row with investment insights.
Check Exercise Status:
Go to the app and verify the exercise toggle shows green, confirming your aggregation mastery.
This exercise introduces core aggregation concepts you’ll need for advanced analytics. You’re building the foundation for complex business intelligence pipelines!
Ready to unlock market insights through data aggregation? Let’s dive in!
Ready for the next challenge?
Continue to: Aggregations: Exercise 2